13.7 Probability
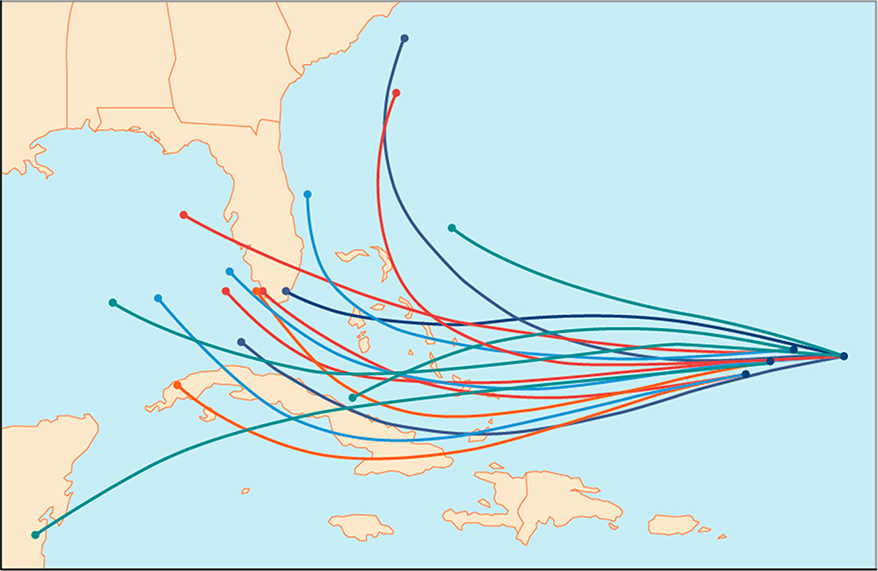
Figure 1 An example of a “spaghetti model,” which can be used to predict possible paths of a tropical storm.
Residents of the Southeastern United States are all too familiar with charts, known as spaghetti models, such as the one in Figure 1. They combine a collection of weather data to predict the most likely path of a hurricane. Each colored line represents one possible path. The group of squiggly lines can begin to resemble strands of spaghetti, hence the name. In this section, we will investigate methods for making these types of predictions.
13.7.1 Constructing Probability Models
Suppose we roll a six-sided number cube. Rolling a number cube is an example of an experiment, or an activity with an observable result. The numbers on the cube are possible results, or outcomes, of this experiment. The set of all possible outcomes of an experiment is called the sample space of the experiment. The sample space for this experiment is \(\left\{ {1,2,3,4,5,6} \right\}.\) An event is any subset of a sample space.
The likelihood of an event is known as probability. The probability of an event \(p\) is a number that always satisfies \(0 \leq p \leq 1,\) where 0 indicates an impossible event and 1 indicates a certain event. A probability model is a mathematical description of an experiment listing all possible outcomes and their associated probabilities. For instance, if there is a 1% chance of winning a raffle and a 99% chance of losing the raffle, a probability model would look much like Table 1.
| Outcome | Probability |
|---|---|
| Winning the raffle | 1% |
| Losing the raffle | 99% |
Table 1
The sum of the probabilities listed in a probability model must equal 1, or 100%.
13.7.2 Computing Probabilities of Equally Likely Outcomes
Let \(S\) be a sample space for an experiment. When investigating probability, an event is any subset of \(S.\) When the outcomes of an experiment are all equally likely, we can find the probability of an event by dividing the number of outcomes in the event by the total number of outcomes in \(S.\) Suppose a number cube is rolled, and we are interested in finding the probability of the event “rolling a number less than or equal to 4.” There are 4 possible outcomes in the event and 6 possible outcomes in \(S,\) so the probability of the event is \(\frac{4}{6} = \frac{2}{3}.\)
13.7.3 Computing the Probability of the Union of Two Events
We are often interested in finding the probability that one of multiple events occurs. Suppose we are playing a card game, and we will win if the next card drawn is either a heart or a king. We would be interested in finding the probability of the next card being a heart or a king. The union of two events \(E\mspace{9mu}\text{and~}F,\text{written~}E \cup F,\) is the event that occurs if either or both events occur.
\[P(E \cup F) = P(E) + P(F) - P(E \cap F)\]
Suppose the spinner in Figure 2 is spun. We want to find the probability of spinning orange or spinning a \(b.\)
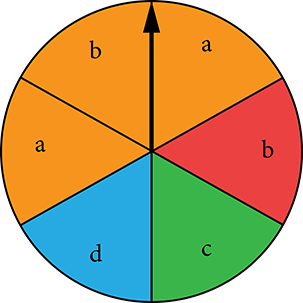
Figure 2
There are a total of 6 sections, and 3 of them are orange. So the probability of spinning orange is \(\frac{3}{6} = \frac{1}{2}.\) There are a total of 6 sections, and 2 of them have a \(b.\) So the probability of spinning a \(b\) is \(\frac{2}{6} = \frac{1}{3}.\) If we added these two probabilities, we would be counting the sector that is both orange and a \(b\) twice. To find the probability of spinning an orange or a \(b,\) we need to subtract the probability that the sector is both orange and has a \(b.\)
\[\frac{1}{2} + \frac{1}{3} - \frac{1}{6} = \frac{2}{3}\]
The probability of spinning orange or a \(b\) is \(\frac{2}{3}.\)
13.7.4 Computing the Probability of Mutually Exclusive Events
Suppose the spinner in Figure 2 is spun again, but this time we are interested in the probability of spinning an orange or a \(d.\) There are no sectors that are both orange and contain a \(d,\) so these two events have no outcomes in common. Events are said to be mutually exclusive events when they have no outcomes in common. Because there is no overlap, there is nothing to subtract, so the general formula is
\[P(E \cup F) = P(E) + P(F)\]
Notice that with mutually exclusive events, the intersection of \(E\) and \(F\) is the empty set. The probability of spinning an orange is \(\frac{3}{6} = \frac{1}{2}\) and the probability of spinning a \(d\) is \(\frac{1}{6}.\) We can find the probability of spinning an orange or a \(d\) simply by adding the two probabilities.
\[\begin{array}{l} {P(E \cup^{}F) = P(E) + P(F)} \\ {\mspace{9mu}\text{~~~~~~~~~~~~~~} = \frac{1}{2} + \frac{1}{6}} \\ {\mspace{9mu}\text{~~~~~~~~~~~~~~} = \frac{2}{3}} \end{array}\]
The probability of spinning an orange or a \(d\) is \(\frac{2}{3}.\)
13.7.5 Using the Complement Rule to Compute Probabilities
We have discussed how to calculate the probability that an event will happen. Sometimes, we are interested in finding the probability that an event will not happen. The complement of an event \(E,\) denoted \(E',\) is the set of outcomes in the sample space that are not in \(E.\) For example, suppose we are interested in the probability that a horse will lose a race. If event \(W\) is the horse winning the race, then the complement of event \(W\) is the horse losing the race.
To find the probability that the horse loses the race, we need to use the fact that the sum of all probabilities in a probability model must be 1.
\[P(E') = 1 - P(E)\]
The probability of the horse winning added to the probability of the horse losing must be equal to 1. Therefore, if the probability of the horse winning the race is \(\frac{1}{9},\) the probability of the horse losing the race is simply
\[1 - \frac{1}{9} = \frac{8}{9}\]
13.7.6 Computing Probability Using Counting Theory
Many interesting probability problems involve counting principles, permutations, and combinations. In these problems, we will use permutations and combinations to find the number of elements in events and sample spaces. These problems can be complicated, but they can be made easier by breaking them down into smaller counting problems.
Assume, for example, that a store has 8 cellular phones and that 3 of those are defective. We might want to find the probability that a couple purchasing 2 phones receives 2 phones that are not defective. To solve this problem, we need to calculate all of the ways to select 2 phones that are not defective as well as all of the ways to select 2 phones. There are 5 phones that are not defective, so there are \(C(5,2)\) ways to select 2 phones that are not defective. There are 8 phones, so there are \(C(8,2)\) ways to select 2 phones. The probability of selecting 2 phones that are not defective is:
\[\begin{array}{l} {\frac{\text{ways~to~select~2~phones~that~are~not~defective}}{\text{ways~to~select~2~phones}} = \frac{C(5,2)}{C(8,2)}} \\ {\mspace{297mu} = \frac{10}{28}} \\ {\mspace{297mu} = \frac{5}{14}} \end{array}\]
Section Exercises
Verbal
1. What term is used to express the likelihood of an event occurring? Are there restrictions on its values? If so, what are they? If not, explain.
Solution (click to reveal)
probability; The probability of an event is restricted to values between \(0\) and \(1,\) inclusive of \(0\) and \(1.\)
2. What is a sample space?
3. What is an experiment?
Solution (click to reveal)
An experiment is an activity with an observable result.
4. What is the difference between events and outcomes? Give an example of both using the sample space of tossing a coin 50 times.
5. The union of two sets is defined as a set of elements that are present in at least one of the sets. How is this similar to the definition used for the union of two events from a probability model? How is it different?
Solution (click to reveal)
The probability of the union of two events occurring is a number that describes the likelihood that at least one of the events from a probability model occurs. In both a union of sets \(A\mspace{9mu}~\text{and~}B\) and a union of events \(A~\text{and}~B,\) the union includes either \(A~\text{or}~B\) or both. The difference is that a union of sets results in another set, while the union of events is a probability, so it is always a numerical value between \(0\) and \(1.\)
Numeric
For the following exercises, use the spinner shown in Figure 3 to find the probabilities indicated.
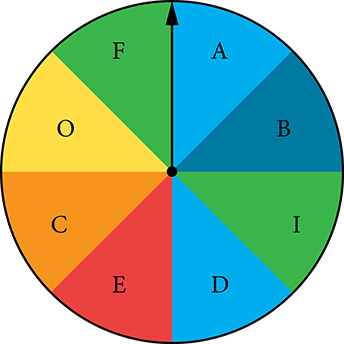
Figure 3
6. Landing on red
7. Landing on a vowel
Solution (click to reveal)
\(\frac{1}{2}.\)
8. Not landing on blue
9. Landing on purple or a vowel
Solution (click to reveal)
\(\frac{5}{8}.\)
10. Landing on blue or a vowel
11. Landing on green or blue
Solution (click to reveal)
\(\frac{1}{2}.\)
12. Landing on yellow or a consonant
13. Not landing on yellow or a consonant
Solution (click to reveal)
\(\frac{3}{8}.\)
For the following exercises, two coins are tossed.
14. What is the sample space?
15. Find the probability of tossing two heads.
Solution (click to reveal)
\(\frac{1}{4}.\)
16. Find the probability of tossing exactly one tail.
17. Find the probability of tossing at least one tail.
Solution (click to reveal)
\(\frac{3}{4}.\)
For the following exercises, four coins are tossed.
18. What is the sample space?
19. Find the probability of tossing exactly two heads.
Solution (click to reveal)
\(\frac{3}{8}.\)
20. Find the probability of tossing exactly three heads.
21. Find the probability of tossing four heads or four tails.
Solution (click to reveal)
\(\frac{1}{8}.\)
22. Find the probability of tossing all tails.
23. Find the probability of tossing not all tails.
Solution (click to reveal)
\(\frac{15}{16}.\)
24. Find the probability of tossing exactly two heads or at least two tails.
25. Find the probability of tossing either two heads or three heads.
Solution (click to reveal)
\(\frac{5}{8}.\)
For the following exercises, one card is drawn from a standard deck of \(52\) cards. Find the probability of drawing the following:
26. A club
27. A two
Solution (click to reveal)
\(\frac{1}{13}.\)
28. Six or seven
29. Red six
Solution (click to reveal)
\(\frac{1}{26}.\)
30. An ace or a diamond
31. A non-ace
Solution (click to reveal)
\(\frac{12}{13}.\)
32. A heart or a non-jack
For the following exercises, two dice are rolled, and the results are summed.
33. Construct a table showing the sample space of outcomes and sums.
Solution (click to reveal)
| 1 | 2 | 3 | 4 | 5 | 6 | |
| \(\mathbf{1}\) | (1,1) 2 |
(1,2) 3 |
(1,3) 4 |
(1,4) 5 |
(1,5) 6 |
(1,6) 7 |
| \(\mathbf{2}\) | (2,1) 3 |
(2,2) 4 |
(2,3) 5 |
(2,4) 6 |
(2,5) 7 |
(2,6) 8 |
| \(\mathbf{3}\) | (3,1) 4 |
(3,2) 5 |
(3,3) 6 |
(3,4) 7 |
(3,5) 8 |
(3,6) 9 |
| \(\mathbf{4}\) | (4,1) 5 |
(4,2) 6 |
(4,3) 7 |
(4,4) 8 |
(4,5) 9 |
(4,6) 10 |
| \(\mathbf{5}\) | (5,1) 6 |
(5,2) 7 |
(5,3) 8 |
(5,4) 9 |
(5,5) 10 |
(5,6) 11 |
| \(\mathbf{6}\) | (6,1) 7 |
(6,2) 8 |
(6,3) 9 |
(6,4) 10 |
(6,5) 11 |
(6,6) 12 |
34. Find the probability of rolling a sum of \(3.\)
35. Find the probability of rolling at least one four or a sum of \(8.\)
Solution (click to reveal)
\(\frac{5}{12}.\)
36. Find the probability of rolling an odd sum less than \(9.\)
37. Find the probability of rolling a sum greater than or equal to \(15.\)
Solution (click to reveal)
\(0.\)
38. Find the probability of rolling a sum less than \(15.\)
39. Find the probability of rolling a sum less than \(6\) or greater than \(9.\)
Solution (click to reveal)
\(\frac{4}{9}.\)
40. Find the probability of rolling a sum between \(6\) and \(9\text{,}\) inclusive.
41. Find the probability of rolling a sum of \(5\) or \(6.\)
Solution (click to reveal)
\(\frac{1}{4}.\)
42. Find the probability of rolling any sum other than \(5\) or \(6.\)
For the following exercises, a coin is tossed, and a card is pulled from a standard deck. Find the probability of the following:
43. A head on the coin or a club
Solution (click to reveal)
\(\frac{5}{8}\)
44. A tail on the coin or red ace
45. A head on the coin or a face card
Solution (click to reveal)
\(\frac{8}{13}\)
46. No aces
For the following exercises, use this scenario: a bag of M&Ms contains \(12\) blue, \(6\) brown, \(10\) orange, \(8\) yellow, \(8\) red, and \(4\) green M&Ms. Reaching into the bag, a person grabs 5 M&Ms.
47. What is the probability of getting all blue M&Ms?
Solution (click to reveal)
\(\frac{C(12,5)}{C(48,5)} = \frac{1}{2162}\)
48. What is the probability of getting \(4\) blue M&Ms?
49. What is the probability of getting \(3\) blue M&Ms?
Solution (click to reveal)
\(\frac{C(12,3)C(36,2)}{C(48,5)} = \frac{175}{2162}\)
50. What is the probability of getting no brown M&Ms?
Extensions
Use the following scenario for the exercises that follow: In the game of Keno, a player starts by selecting \(20\) numbers from the numbers \(1\) to \(80.\) After the player makes his selections, \(20\) winning numbers are randomly selected from numbers \(1\) to \(80.\) A win occurs if the player has correctly selected \(3,4,\) or \(5\) of the \(20\) winning numbers. (Round all answers to the nearest hundredth of a percent.)
51. What is the percent chance that a player selects exactly 3 winning numbers?
Solution (click to reveal)
\(\frac{C(20,3)C(60,17)}{C(80,20)} \approx 12.49\%\)
52. What is the percent chance that a player selects exactly 4 winning numbers?
53. What is the percent chance that a player selects all 5 winning numbers?
Solution (click to reveal)
\(\frac{C(20,5)C(60,15)}{C(80,20)} \approx 23.33\%\)
54. What is the percent chance of winning?
55. How much less is a player’s chance of selecting 3 winning numbers than the chance of selecting either 4 or 5 winning numbers?
Solution (click to reveal)
\(20.50 + 23.33 - 12.49 = 31.34\%\)
Real-World Applications
Use this data for the exercises that follow: In 2013, there were roughly 317 million citizens in the United States, and about 40 million were elderly (aged 65 and over).
56. If you meet a U.S. citizen, what is the percent chance that the person is elderly? (Round to the nearest tenth of a percent.)
57. If you meet five U.S. citizens, what is the percent chance that exactly one is elderly? (Round to the nearest tenth of a percent.)
Solution (click to reveal)
\(\frac{C(40000000,1)C(277000000,4)}{C(317000000,5)} = 36.78\%\)
58. If you meet five U.S. citizens, what is the percent chance that three are elderly? (Round to the nearest tenth of a percent.)
59. If you meet five U.S. citizens, what is the percent chance that four are elderly? (Round to the nearest thousandth of a percent.)
Solution (click to reveal)
\(\frac{C(40000000,4)C(277000000,1)}{C(317000000,5)} = 0.11\%\)
60. It is predicted that by 2030, one in five U.S. citizens will be elderly. How much greater will the chances of meeting an elderly person be at that time? What policy changes do you foresee if these statistics hold true?