Chapter Review
Key Terms
correlation coefficient — a value, \(r,\) between –1 and 1 that indicates the degree of linear correlation of variables, or how closely a regression line fits a data set.
decreasing linear function — a function with a negative slope: If \(f(x) = mx + b,~\text{then}~m < 0\)
extrapolation — predicting a value outside the domain and range of the data
horizontal line — a line defined by \(f(x) = b,\) where \(b\) is a real number. The slope of a horizontal line is 0.
increasing linear function — a function with a positive slope: If \(f(x) = mx + b,~\text{then}~m > 0.\)
interpolation — predicting a value inside the domain and range of the data
least squares regression — a statistical technique for fitting a line to data in a way that minimizes the differences between the line and data values
linear function — a function with a constant rate of change that is a polynomial of degree 1, and whose graph is a straight line
model breakdown — when a model no longer applies after a certain point
parallel lines — two or more lines with the same slope
perpendicular lines — two lines that intersect at right angles and have slopes that are negative reciprocals of each other
point-slope form — the equation for a line that represents a linear function of the form \(y - y_{1} = m\left( {x - x_{1}} \right)\)
slope — the ratio of the change in output values to the change in input values; a measure of the steepness of a line
slope-intercept form — the equation for a line that represents a linear function in the form \(f(x) = mx + b\)
vertical line — a line defined by \(x = a,\) where \(a\) is a real number. The slope of a vertical line is undefined.
Key Concepts
4.1 Linear Functions
- Linear functions can be represented in words, function notation, tabular form, and graphical form. See Example 1.
- An increasing linear function results in a graph that slants upward from left to right and has a positive slope. A decreasing linear function results in a graph that slants downward from left to right and has a negative slope. A constant linear function results in a graph that is a horizontal line. See Example 2.
- Slope is a rate of change. The slope of a linear function can be calculated by dividing the difference between \(y\)-values by the difference in corresponding \(x\)-values of any two points on the line. See Example 3 and Example 4.
- An equation for a linear function can be written from a graph. See Example 5.
- The equation for a linear function can be written if the slope \(m\) and initial value \(b\) are known. See Example 6 and Example 7.
- A linear function can be used to solve real-world problems given information in different forms. See Example 8, Example 9, and Example 10.
- Linear functions can be graphed by plotting points or by using the \(y\)-intercept and slope. See Example 11 and Example 12.
- Graphs of linear functions may be transformed by using shifts up, down, left, or right, as well as through stretches, compressions, and reflections. See Example 13.
- The equation for a linear function can be written by interpreting the graph. See Example 14.
- The \(x\)-intercept is the point at which the graph of a linear function crosses the \(x\)-axis. See Example 15.
- Horizontal lines are written in the form, \(f(x) = b.\) See Example 16.
- Vertical lines are written in the form, \(x = b.\) See Example 17.
- Parallel lines have the same slope. Perpendicular lines have negative reciprocal slopes, assuming neither is vertical. See Example 18.
- A line parallel to another line, passing through a given point, may be found by substituting the slope value of the line and the \(x\)- and \(y\)-values of the given point into the equation, \(f(x) = mx + b,\) and using the \(b\) that results. Similarly, the point-slope form of an equation can also be used. See Example 19.
- A line perpendicular to another line, passing through a given point, may be found in the same manner, with the exception of using the negative reciprocal slope. See Example 20 and Example 21.
4.2 Modeling with Linear Functions
We can use the same problem strategies that we would use for any type of function.
When modeling and solving a problem, identify the variables and look for key values, including the slope and \(y\)-intercept. See Example 1.
Draw a diagram, where appropriate. See Example 2 and Example 3.
Check for reasonableness of the answer.
Linear models may be built by identifying or calculating the slope and using the \(y\)-intercept.
The \(x\)-intercept may be found by setting \(y = 0,\) which is setting the expression \(mx + b\) equal to 0.
The point of intersection of a system of linear equations is the point where the \(x\)- and \(y\)-values are the same. See Example 4.
A graph of the system may be used to identify the points where one line falls below (or above) the other line.
4.3 Fitting Linear Models to Data
- Scatter plots show the relationship between two sets of data. See Example 1.
- Scatter plots may represent linear or non-linear models.
- The line of best fit may be estimated or calculated, using a calculator or statistical software. See Example 2.
- Interpolation can be used to predict values inside the domain and range of the data, whereas extrapolation can be used to predict values outside the domain and range of the data. See Example 3.
- The correlation coefficient, \(r,\) indicates the degree of linear relationship between data. See Example 4.
- A regression line best fits the data. See Example 5.
- The least squares regression line is found by minimizing the squares of the distances of points from a line passing through the data and may be used to make predictions regarding either of the variables. See Example 6.
Chapter Review Exercises
Linear Functions
1. Determine whether the algebraic equation is linear. \(2x + 3y = 7\)
Solution (click to reveal)
Yes
2. Determine whether the algebraic equation is linear. \(6x^{2} - y = 5\)
3. Determine whether the function is increasing or decreasing.
\(f(x) = 7x - 2\)
Solution (click to reveal)
Increasing
4. Determine whether the function is increasing or decreasing.
\(g(x) = - x + 2\)
5. Given each set of information, find a linear equation that satisfies the given conditions, if possible.
Passes through \(\left( {\text{7},\text{5}} \right)\) and \(\left( {\text{3},\text{17}} \right)\)
Solution (click to reveal)
\(y = - \text{3}x + \text{26}\)
6. Given each set of information, find a linear equation that satisfies the given conditions, if possible.
\(x\)-intercept at \(\left( {\text{6},0} \right)\) and \(y\)-intercept at \(\left( {0,\text{1}0} \right)\)
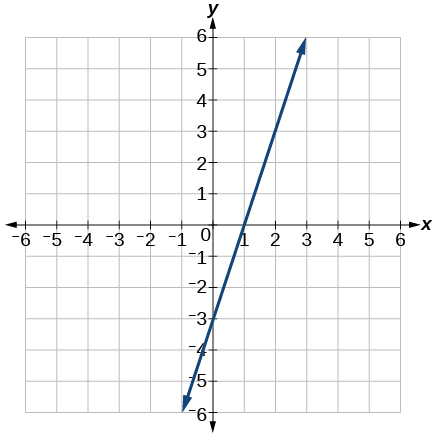
7. Find the slope of the line shown in the graph.
Solution (click to reveal)
3
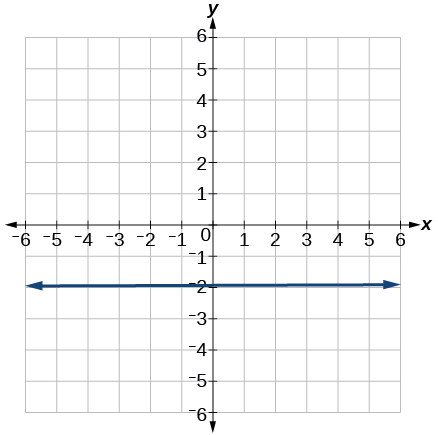
8. Find the slope of the line graphed.
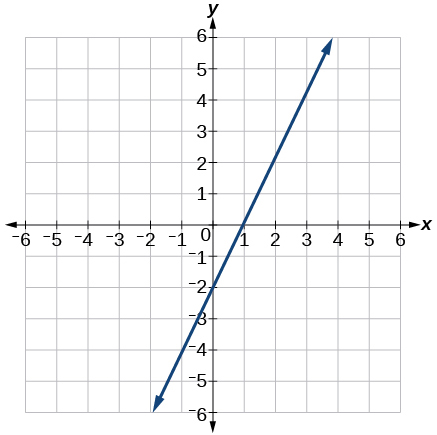
9. Write an equation in slope-intercept form for the line shown.
Solution (click to reveal)
\(y = \text{2}x - \text{2}\)
10. Does the following table represent a linear function? If so, find the linear equation that models the data.
| \(x\) | –4 | 0 | 2 | 10 |
| g(x) | 18 | –2 | –12 | –52 |
11. Does the following table represent a linear function? If so, find the linear equation that models the data.
| \(x\) | 6 | 8 | 12 | 26 |
| g(x) | –8 | –12 | –18 | –46 |
Solution (click to reveal)
Not linear.
12. On June 1st, a company has $4,000,000 profit. If the company then loses 150,000 dollars per day thereafter in the month of June, what is the company’s profit nth day after June 1st?
For the following exercises, determine whether the lines given by the equations below are parallel, perpendicular, or neither parallel nor perpendicular:
13. \(\begin{matrix} {2x - 6y = 12} \\ {- x + 3y = 1} \end{matrix}\)
Solution (click to reveal)
parallel
14. \(\begin{matrix} {y = \frac{1}{3}x - 2} \\ {3x + y = - 9} \end{matrix}\)
For the following exercises, find the \(x\)- and \(y\)- intercepts of the given equation
15. \(7x + 9y = - 63\)
Solution (click to reveal)
\((–9,0);(0,–7)\)
16. \(f(x) = 2x - 1\)
For the following exercises, use the descriptions of the pairs of lines to find the slopes of Line 1 and Line 2. Is each pair of lines parallel, perpendicular, or neither?
17. Line 1: Passes through \((5,11)\) and \((10,1)\)
Line 2: Passes through \((-1,3)\) and \((-5,11)\)
Solution (click to reveal)
Line 1: \(m = - 2;\) Line 2: \(m = - 2;\) Parallel
18. Line 1: Passes through \((8,-10)\) and \((0,-26)\)
Line 2: Passes through \((2,5)\) and \((4,4)\)
19. Write an equation for a line perpendicular to \(f(x) = 5x - 1\) and passing through the point (5, 20).
Solution (click to reveal)
\(y = - 0.2x + 21\)
20. Find the equation of a line with a \(y\)- intercept of \(\left( {0,2} \right)\) and slope \(- \frac{1}{2}.\)
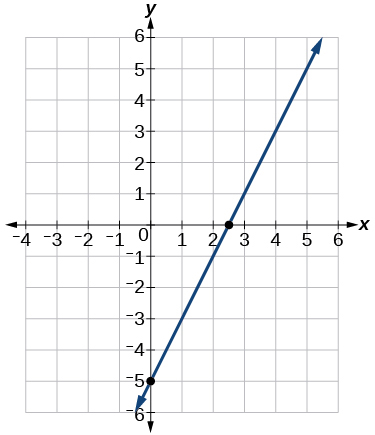
21. Sketch a graph of the linear function \(f(t) = 2t - 5.\)
Solution (click to reveal)
22. Find the point of intersection for the 2 linear functions: \(\begin{matrix} {x = y + 6} \\ {2x - y = 13} \end{matrix}.\)
23. A car rental company offers two plans for renting a car.
Plan A: 25 dollars per day and 10 cents per mile
Plan B: 50 dollars per day with free unlimited mileage
How many miles would you need to drive for plan B to save you money?
Solution (click to reveal)
More than 250
Modeling with Linear Functions
24. Find the area of a triangle bounded by the \(y\) axis, the line \(f(x) = 10 - 2x,\) and the line perpendicular to \(f\) that passes through the origin.
25. A town’s population increases at a constant rate. In 2010 the population was 55,000. By 2012 the population had increased to 76,000. If this trend continues, predict the population in 2016.
Solution (click to reveal)
118,000
26. The number of people afflicted with the common cold in the winter months dropped steadily by 50 each year since 2004 until 2010. In 2004, 875 people were inflicted.
Find the linear function that models the number of people afflicted with the common cold \(C\) as a function of the year, \(t.\) When will no one be afflicted?
For the following exercises, use the graph in Figure 11 showing the profit, \(y,\) in thousands of dollars, of a company in a given year, \(x,\) where \(x\) represents years since 1980.
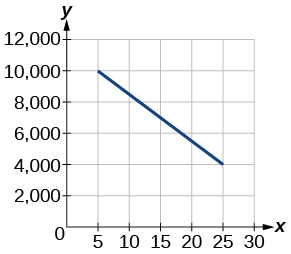
Figure 11
27. Find the linear function \(y\), where \(y\) depends on \(x,\) the number of years since 1980.
Solution (click to reveal)
\(y = - \text{3}00x + \text{11},\text{5}00\)
28. Find and interpret the \(y\)-intercept.
For the following exercise, consider this scenario: In 2004, a school population was 1,700. By 2012 the population had grown to 2,500.
29. Assume the population is changing linearly.
ⓐ How much did the population grow between the year 2004 and 2012?
ⓑ What is the average population growth per year?
ⓒ Find an equation for the population, \(P\), of the school \(t\) years after 2004.
Solution (click to reveal)
ⓐ \(800\) ⓑ 100 students per year ⓒ \(P(t) = \text{1}00t + \text{17}00\)
For the following exercises, consider this scenario: In 2000, the moose population in a park was measured to be 6,500. By 2010, the population was measured to be 12,500. Assume the population continues to change linearly.
30. Find a formula for the moose population, \(P\).
31. What does your model predict the moose population to be in 2020?
Solution (click to reveal)
18,500
For the following exercises, consider this scenario: The median home values in subdivisions Pima Central and East Valley (adjusted for inflation) are shown in Table 7. Assume that the house values are changing linearly.
| Year | Pima Central | East Valley |
|---|---|---|
| 1970 | 32,000 | 120,250 |
| 2010 | 85,000 | 150,000 |
Table 7
32. In which subdivision have home values increased at a higher rate?
33. If these trends were to continue, what would be the median home value in Pima Central in 2015?
Solution (click to reveal)
$91,625
Fitting Linear Models to Data
34. Draw a scatter plot for the data in Table 8. Then determine whether the data appears to be linearly related.
| 0 | -105 |
| 2 | -50 |
| 4 | 1 |
| 6 | 55 |
| 8 | 105 |
| 10 | 160 |
Table 8
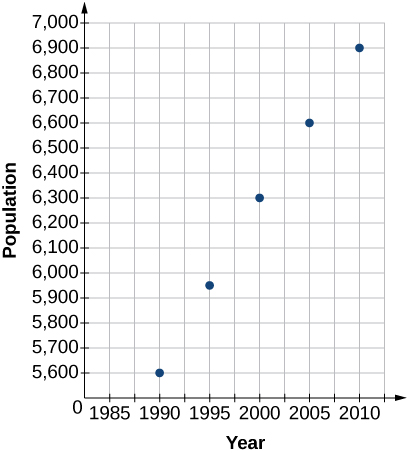
35. Draw a scatter plot for the data in Table 9. If we wanted to know when the population would reach 15,000, would the answer involve interpolation or extrapolation?
| Year | Population |
|---|---|
| 1990 | 5,600 |
| 1995 | 5,950 |
| 2000 | 6,300 |
| 2005 | 6,600 |
| 2010 | 6,900 |
Table 9
Solution (click to reveal)
Extrapolation
36. Eight students were asked to estimate their score on a 10-point quiz. Their estimated and actual scores are given in Table 10. Plot the points, then sketch a line that fits the data.
| Predicted | Actual |
|---|---|
| 6 | 6 |
| 7 | 7 |
| 7 | 8 |
| 8 | 8 |
| 7 | 9 |
| 9 | 10 |
| 10 | 10 |
| 10 | 9 |
Table 10
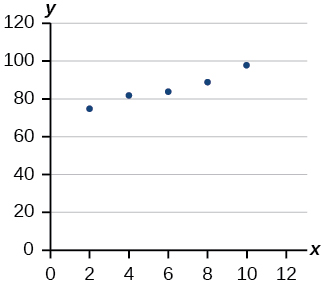
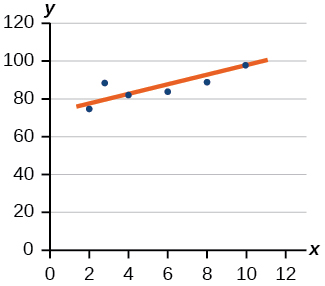
37. Draw a best-fit line for the plotted data.
Solution (click to reveal)
For the following exercises, consider the data in Table 11, which shows the percent of unemployed in a city of people 25 years or older who are college graduates is given below, by year.
| Year | 2000 | 2002 | 2005 | 2007 | 2010 |
| Percent Graduates | 6.5 | 7.0 | 7.4 | 8.2 | 9.0 |
Table 11
38. Determine whether the trend appears to be linear. If so, and assuming the trend continues, find a linear regression model to predict the percent of unemployed in a given year to three decimal places.
39. In what year will the percentage exceed 12%?
Solution (click to reveal)
2023
40. Based on the set of data given in Table 12, calculate the regression line using a calculator or other technology tool, and determine the correlation coefficient to three decimal places.
| \(x\) | 17 | 20 | 23 | 26 | 29 |
| \(y\) | 15 | 25 | 31 | 37 | 40 |
Table 12
41. Based on the set of data given in Table 13, calculate the regression line using a calculator or other technology tool, and determine the correlation coefficient to three decimal places.
| \(x\) | 10 | 12 | 15 | 18 | 20 |
| \(y\) | 36 | 34 | 30 | 28 | 22 |
Table 13
Solution (click to reveal)
\(y = - 1.294x + 49.412;~r = - 0.974\)
For the following exercises, consider this scenario: The population of a city increased steadily over a ten-year span. The following ordered pairs show the population and the year over the ten-year span (population, year) for specific recorded years:
\((\text{3,6}00,2000);(\text{4,}000,2001);(\text{4,7}00,2003);(\text{6,}000,2006)\)
42. Use linear regression to determine a function \(y,\) where the year depends on the population, to three decimal places of accuracy.
43. Predict when the population will hit 12,000.
Solution (click to reveal)
2027
44. What is the correlation coefficient for this model to three decimal places of accuracy?
45. According to the model, what is the population in 2014?
Solution (click to reveal)
7,660
Chapter Practice Test
1. Determine whether the following algebraic equation can be written as a linear function. \(2x + 3y = 7\)
Solution (click to reveal)
Yes
2. Determine whether the following function is increasing or decreasing. \(f(x) = - 2x + 5\)
3. Determine whether the following function is increasing or decreasing. \(f(x) = 7x + 9\)
Solution (click to reveal)
Increasing
4. Find a linear equation that passes through (5, 1) and (3, –9), if possible.
5. Find a linear equation, that has an \(x\) intercept at (–4, 0) and a \(y\)-intercept at (0, –6), if possible.
Solution (click to reveal)
y = −1.5x − 6
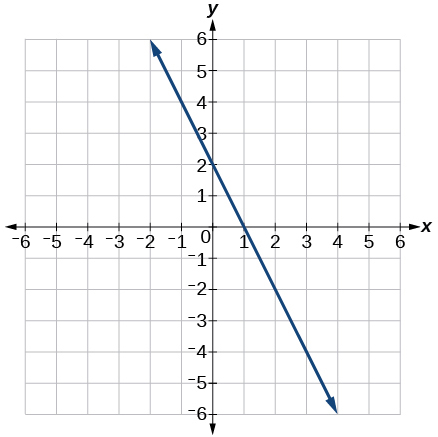
6. Find the slope of the line in .
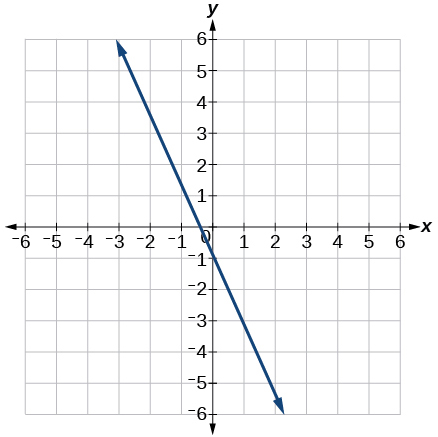
7. Write an equation for line in .
Solution (click to reveal)
y = −2x − 1
8. Does represent a linear function? If so, find a linear equation that models the data.
| \(x\) | –6 | 0 | 2 | 4 |
| \(g(x)\) | 14 | 32 | 38 | 44 |
9. Does represent a linear function? If so, find a linear equation that models the data.
| \(x\) | 1 | 3 | 7 | 11 |
| \(g\)(\(x\)) | 4 | 9 | 19 | 12 |
Solution (click to reveal)
No
10. At 6 am, an online company has sold 120 items that day. If the company sells an average of 30 items per hour for the remainder of the day, write an expression to represent the number of items that were sold \(n\) after 6 am.
For the following exercises, determine whether the lines given by the equations below are parallel, perpendicular, or neither parallel nor perpendicular.
11. \(\begin{matrix} {y = \frac{3}{4}x - 9} \\ {- 4x - 3y = 8} \end{matrix}\)
Solution (click to reveal)
Perpendicular
12. \(\begin{matrix} {- 2x + y = 3} \\ {3x + \frac{3}{2}y = 5} \end{matrix}\)
13. Find the \(x\)- and \(y\)-intercepts of the equation \(2x + 7y = - 14.\)
Solution (click to reveal)
(−7, 0); (0, −2)
14. Given below are descriptions of two lines. Find the slopes of Line 1 and Line 2. Is the pair of lines parallel, perpendicular, or neither?
Line 1: Passes through \((-2,-6)\) and \((3,14)\)
Line 2: Passes through \((2,6)\) and \((4,14)\)
15. Write an equation for a line perpendicular to \(f(x) = 4x + 3\) and passing through the point \((8,10).\)
Solution (click to reveal)
y = −0.25x + 12
16. Sketch a line with a \(y\)-intercept of \(\left( {0,\text{5}} \right)\) and slope \(- \frac{5}{2}.\)
17. Graph of the linear function \(f(x) = - x + 6.\)
Solution (click to reveal)
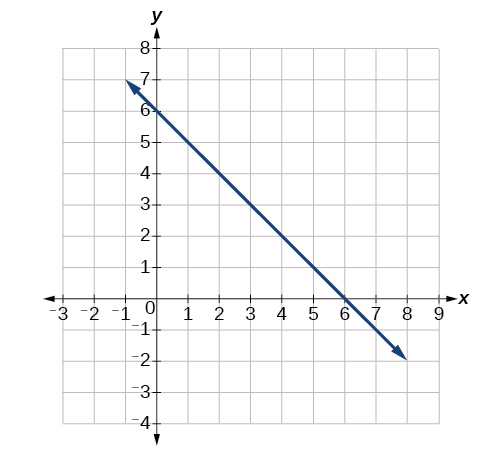
Slope = −1 and y-intercept = 6
18. For the two linear functions, find the point of intersection: \(\begin{matrix} {x = y + 2} \\ {2x - 3y = - 1} \end{matrix}.\)
19. A car rental company offers two plans for renting a car.
Plan A: $25 per day and $0.10 per mile
Plan B: $40 per day with free unlimited mileage
How many miles would you need to drive for plan B to save you money?
Solution (click to reveal)
150
20. Find the area of a triangle bounded by the \(y\) axis, the line \(f(x) = 12 - 4x,\) and the line perpendicular to \(f\) that passes through the origin.
21. A town’s population increases at a constant rate. In 2010 the population was 65,000. By 2012 the population had increased to 90,000. Assuming this trend continues, predict the population in 2018.
Solution (click to reveal)
165,000
22. The number of people afflicted with the common cold in the winter months dropped steadily by 25 each year since 2002 until 2012. In 2002, 8,040 people were inflicted. Find the linear function that models the number of people afflicted with the common cold \(C\) as a function of the year, \(t.\) When will less than 6,000 people be afflicted?
For the following exercises, use the graph in , showing the profit, \(y,\) in thousands of dollars, of a company in a given year, \(x,\) where \(x\) represents years since 1980.
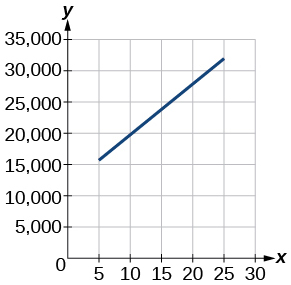
23. Find the linear function \(y,\) where \(y\) depends on \(x,\) the number of years since 1980.
Solution (click to reveal)
y = 875x + 10,625
24. Find and interpret the \(y\)-intercept.
25. In 2004, a school population was 1250. By 2012 the population had dropped to 875. Assume the population is changing linearly.
ⓐ How much did the population drop between the year 2004 and 2012?
ⓑ What is the average population decline per year?
ⓒ Find an equation for the population, \(P\), of the school \(t\) years after 2004.
Solution (click to reveal)
ⓐ \(375\)
ⓑ dropped an average of 46.875, or about 47 people per year
ⓒ y = −46.875t + 1250
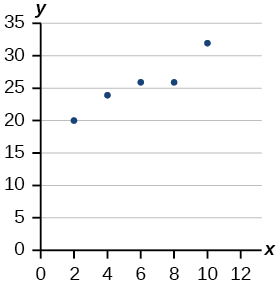
26. Draw a scatter plot for the data provided in . Then determine whether the data appears to be linearly related.
| 0 | 2 | 4 | 6 | 8 | 10 |
| –450 | –200 | 10 | 265 | 500 | 755 |
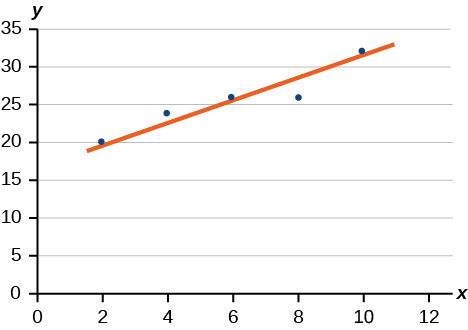
27. Draw a best-fit line for the plotted data.
Solution (click to reveal)
For the following exercises, use , which shows the percent of unemployed persons 25 years or older who are college graduates in a particular city, by year.
| Year | 2000 | 2002 | 2005 | 2007 | 2010 |
| Percent Graduates | 8.5 | 8.0 | 7.2 | 6.7 | 6.4 |
28. Determine whether the trend appears linear. If so, and assuming the trend continues, find a linear regression model to predict the percent of unemployed in a given year to three decimal places.
29. In what year will the percentage drop below 4%?
Solution (click to reveal)
In early 2018
30. Based on the set of data given in , calculate the regression line using a calculator or other technology tool, and determine the correlation coefficient. Round to three decimal places of accuracy.
| \(x\) | 16 | 18 | 20 | 24 | 26 |
| \(y\) | 106 | 110 | 115 | 120 | 125 |
For the following exercises, consider this scenario: The population of a city increased steadily over a ten-year span. The following ordered pairs shows the population (in hundreds) and the year over the ten-year span, (population, year) for specific recorded years:
\((4{,}500,2000);(4{,}700,2001);(5{,}200,2003);(5{,}800,2006)\)
31. Use linear regression to determine a function \(y\), where the year depends on the population. Round to three decimal places of accuracy.
Solution (click to reveal)
y = 0.00455x + 1979.5
32. Predict when the population will hit 20,000.
33. What is the correlation coefficient for this model?
Solution (click to reveal)
r = 0.999